 N Graph
v1.3.0
N Graph
v1.3.0
N Graph
v1.3.0
N Graph
v1.3.0
Notion now has native charts. N Graph fills the gaps: relation maps, heatmaps, statistical charts, KPI cards, radar charts, and PNG copy/export — all browser-only.
* Requires database in Table view
Works on app.notion.com and www.notion.so. Built for the use cases Notion native charts still do not cover.
Export any chart together with its source table as one self-contained interactive HTML file, then drag it into a Notion HTML block. Tooltips, legend toggles, sortable table, and palette switching keep working right inside Notion — no CDN, no dependencies. 8 chart types supported, including the relation map with live physics simulation.
Notion is moving from www.notion.so to app.notion.com — and N Graph v1.3.0 runs on both. If your charts stopped showing up after Notion's migration, just update the extension and they're back.
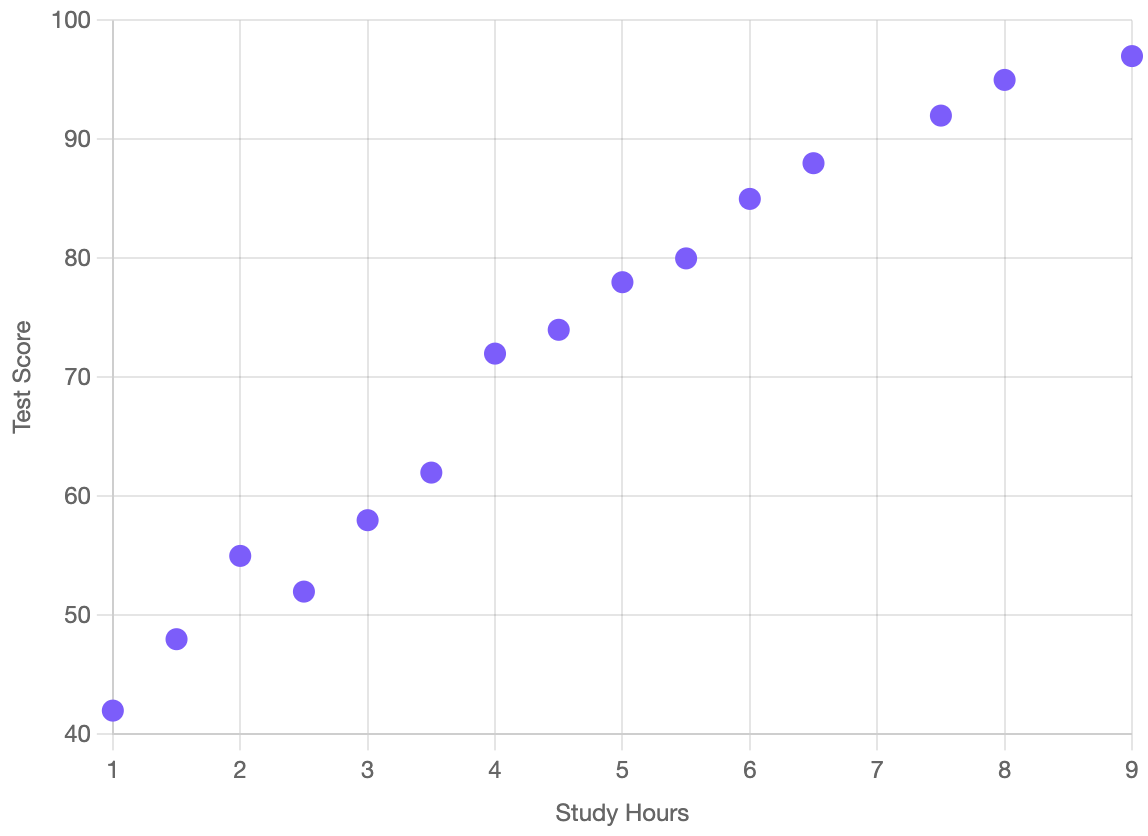
Scatter plot with trend lines, p-values, R², and 95% confidence intervals — no subscription required. Custom axis titles, X/Y min-max, log scale, grid and tick step all available on the free tier.
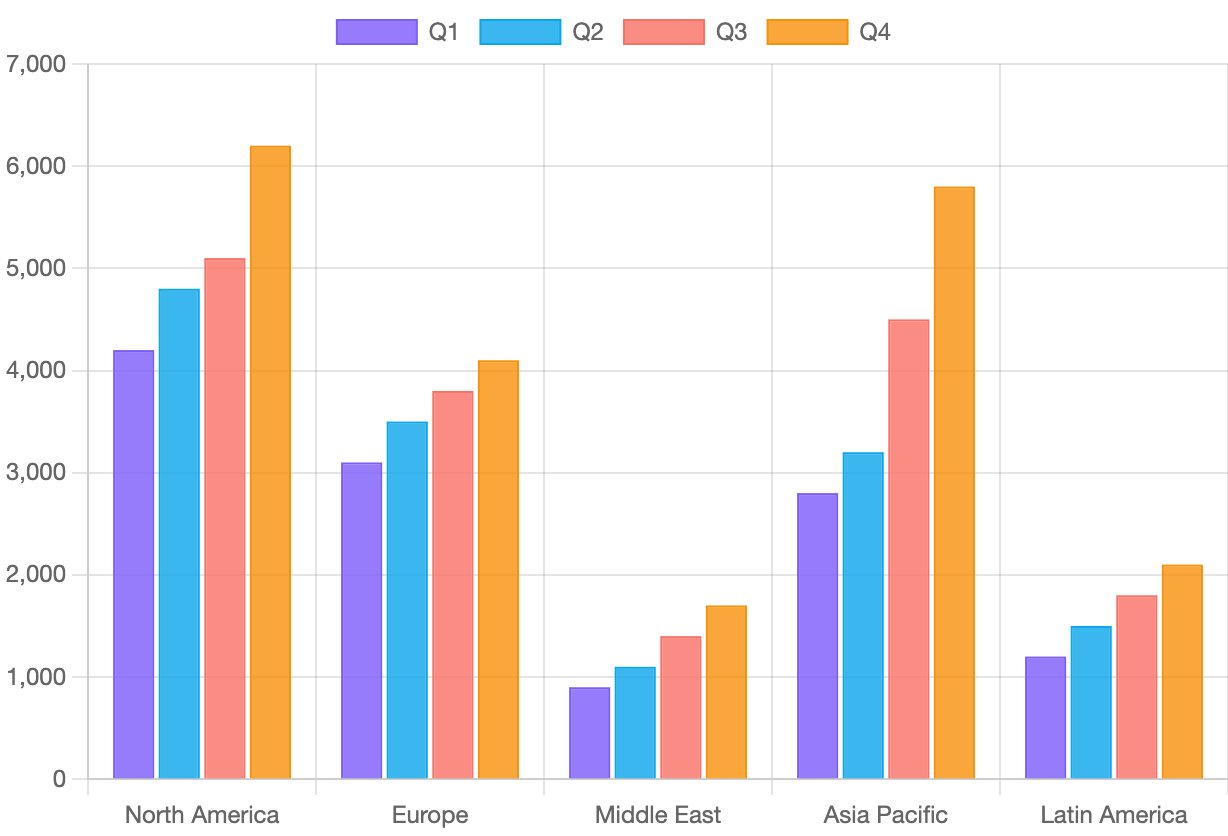
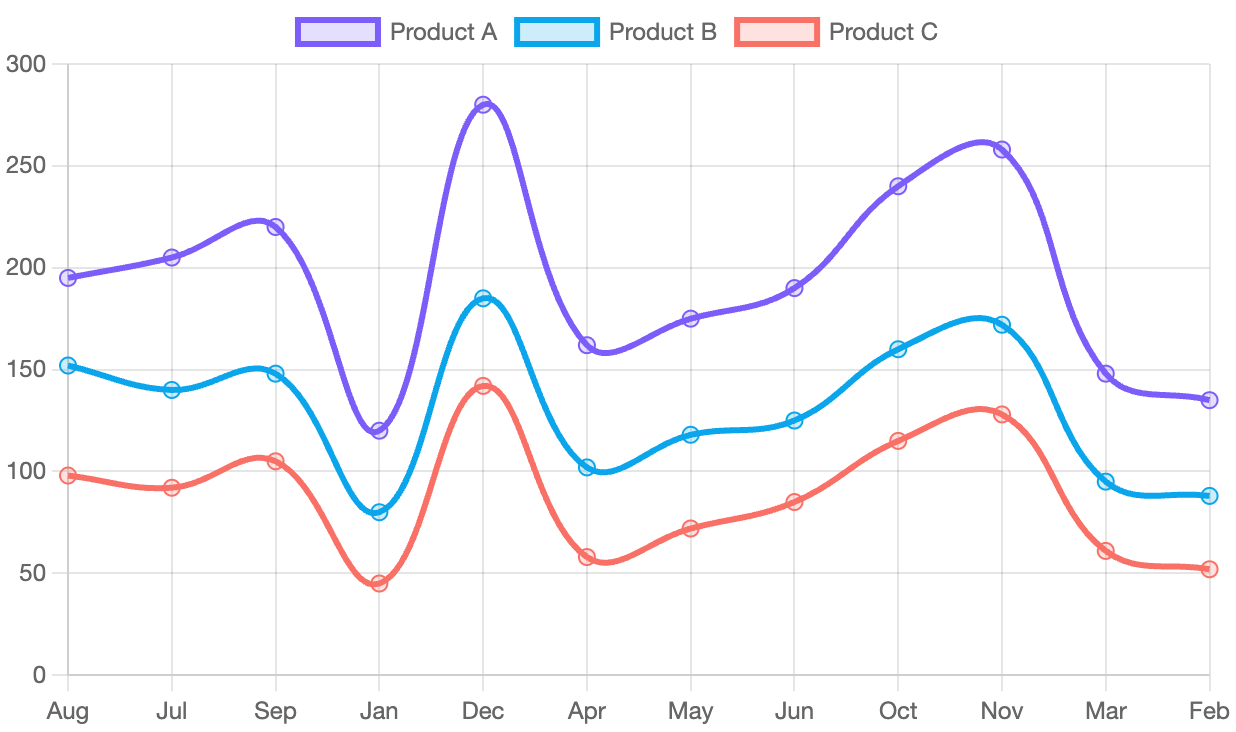
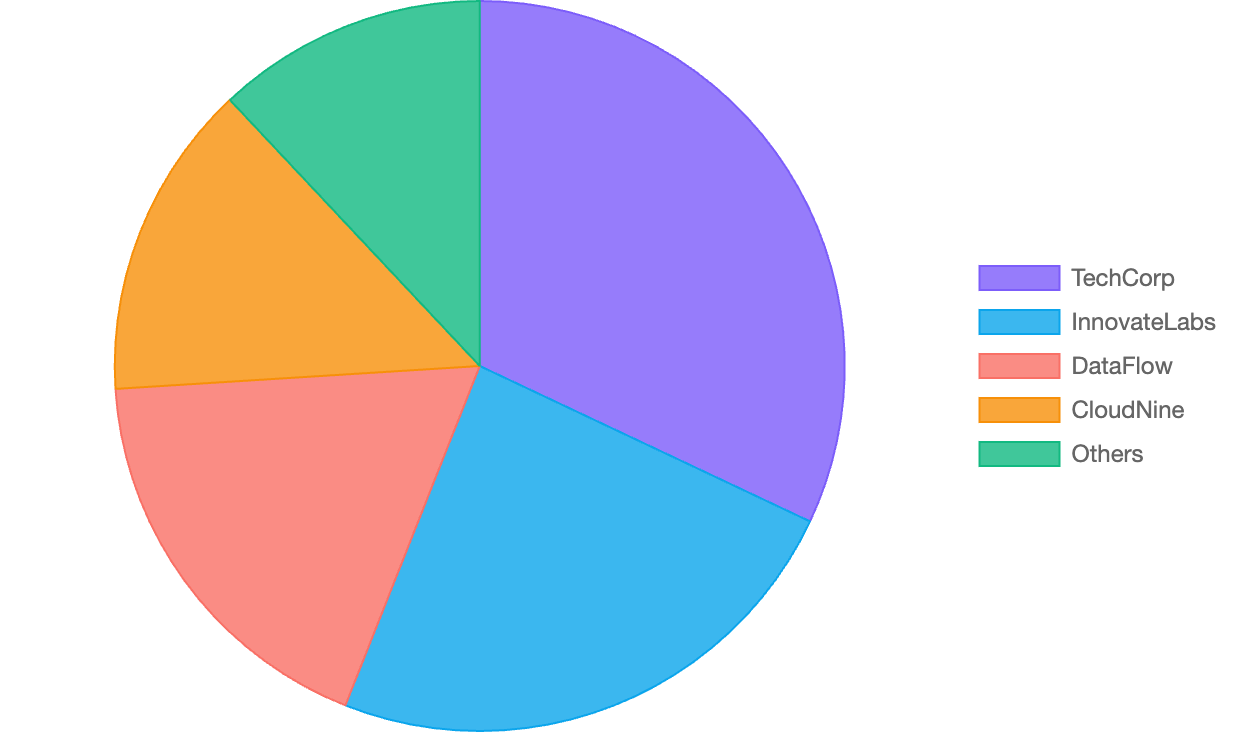
Bar & Line: pick the X-axis column, sort A-Z / Z-A / by value, toggle zeros, cumulative Y-axis, decimal places, baseline and range. Pie: label column, count / sum basis, sort. All with drag-and-drop column reordering.
Gray, Blue, Yellow, Green, Purple, Teal, Orange, Pink, Red — each an 8-shade monochromatic gradient that matches Notion's native look. Plus height (S/M/L), grid style, data labels and caption controls for every chart.
Use Notion Charts for built-in dashboard reporting. Use N Graph when you need exploratory visuals, statistical checks, or a shareable PNG in seconds.
N Graph parses the visible table in your browser. No CSV upload and no Notion API token required.
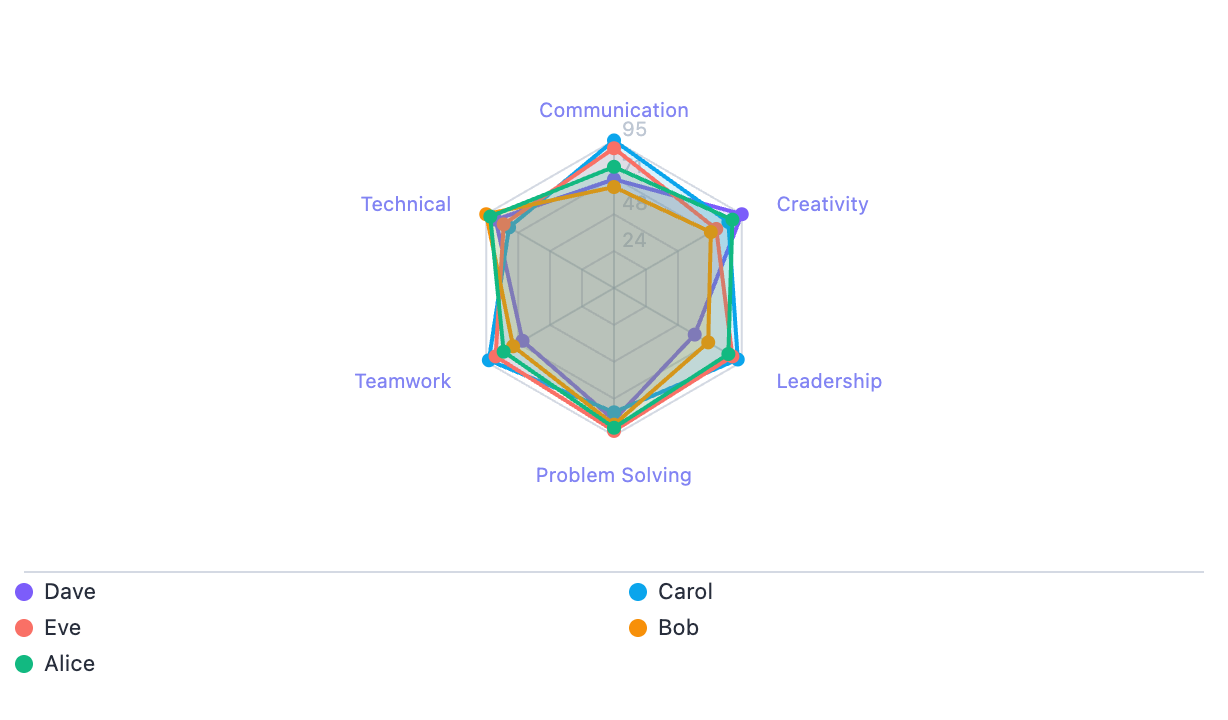
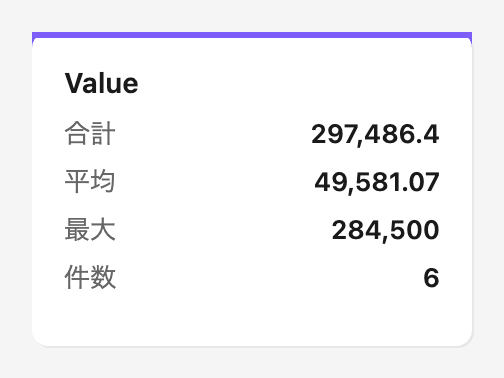
Relation map, calendar heatmap, box plot, histogram, KPI, and radar charts turn databases into insight, not just dashboard widgets.
Copy or download PNGs for docs, slides, reports, and social posts without rebuilding charts elsewhere.
No data export. No CSV upload. Works directly on your Notion page.
Keep Notion charts for dashboards; use N Graph for relation maps, heatmaps, radar, outliers, distributions, and quick PNG sharing.
GitHub-style heatmaps. Auto-detect date columns. Count tasks or sum values. Annual grid & monthly calendar.
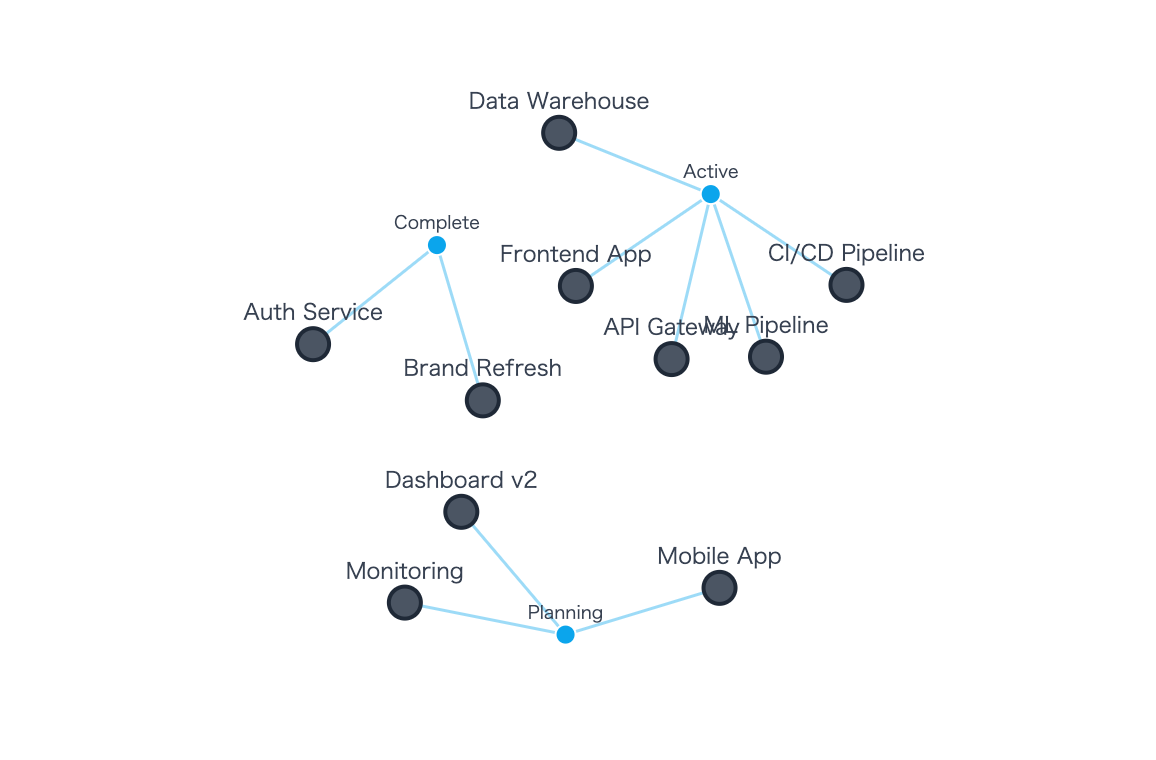
Interactive force-directed graph. Drag nodes, adjust physics, discover hidden relationships.
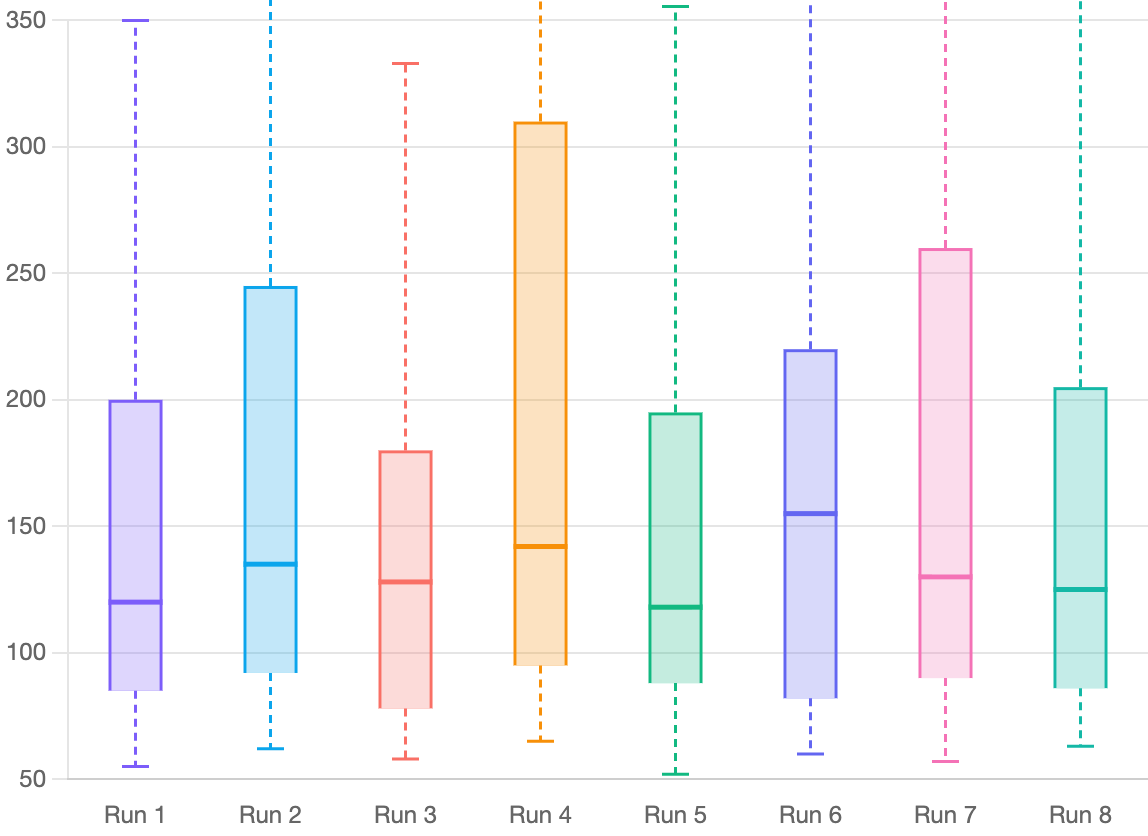
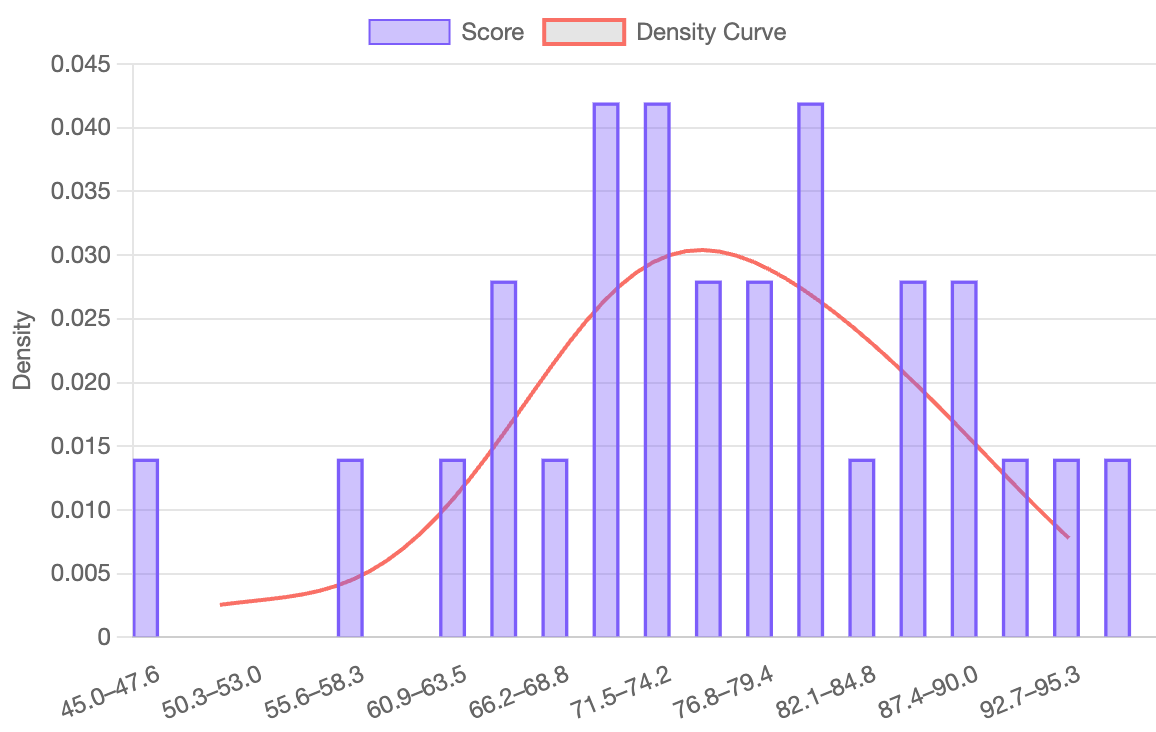
Scatter: trend lines, p-values, R², 95% CI. Box plot: outlier detection. Histogram: density curves.
Download charts as PNG, or export an interactive chart + table as an HTML block you can drop right back into Notion (Pro). See a live exported sample.
Full English, Japanese, and Korean support. All UI elements fully localized.
From simple bar charts to advanced statistical plots

Three steps. Under 30 seconds.
Add N Graph from the Chrome Web Store. No account needed. Bar, line, pie, and scatter charts are free forever.
Navigate to any Notion page with a database in Table view. Board, gallery, timeline, and calendar views are not supported.
Click the N Graph tab on the right side of the page. Choose from 10 chart types and export as PNG.
Free charts for everyday work. Pro unlocks the advanced views people export and share.
After checkout, sign in to the extension with the same email you used to pay — that activates Pro.
Cancel anytime: extension settings → "Manage subscription". Can't sign in? Just email notiongraph123@gmail.com and we'll cancel it for you.
Notionに標準チャートがある今、N Graphは「足りない可視化」に集中。関係マップ、ヒートマップ、統計チャート、KPI、レーダー、PNGコピー/保存をブラウザ内だけで実行します。
※ データベースのテーブル表示のみ対応
app.notion.com / www.notion.so 両対応。Notion標準チャートでは足りない分析ビューを追加。
グラフと元テーブルを1つの自己完結インタラクティブHTMLとして書き出し、NotionのHTMLブロックにドラッグするだけ。ツールチップ・凡例トグル・テーブルのソート・パレット切替がNotion内でそのまま動作します(CDN・外部依存なし)。物理シミュレーション付きリレーションマップを含む8種に対応。
Notionは www.notion.so から app.notion.com への移行を進めています。v1.3.0 はどちらのドメインでも動作します。移行後にチャートが表示されなくなった場合は、拡張機能を更新するだけで復帰します。
トレンドライン・p値・R²・95%信頼区間つきの散布図がPro不要で使えるようになりました。軸タイトル、X/Y軸のmin/max、対数スケール、グリッドライン、目盛り幅まで全て無料枠で調整可能。
棒・折れ線: X軸の列選択、A-Z/Z-A/値の昇降順ソート、ゼロ除外、Y軸累積モード、小数点位置、ベースライン、範囲。円グラフ: ラベル列・集計方式(件数/合計)・ソート。Y軸のドラッグ並べ替えも搭載。
グレー・ブルー・イエロー・グリーン・パープル・ティール・オレンジ・ピンク・レッドの各色8段階グラデーション。Notionの見た目と調和。高さ(S/M/L)、グリッドスタイル、データラベル、キャプションも全チャートで設定可能に。
標準チャートはダッシュボード用途に強い。一方でN Graphは、探索・統計・関係性の発見・PNG共有に特化します。
表示中のテーブルをDOMから読むだけ。CSVアップロードもNotion APIトークンも不要です。
関係マップ、カレンダーヒートマップ、箱ひげ図、ヒストグラム、KPI、レーダーで“ただのグラフ”以上の洞察へ。
PNG保存・クリップボードコピーで、資料・レポート・SNS投稿にすぐ貼れます。
データのエクスポート不要。CSV不要。Notionページ上で直接動作。
Notion標準チャートはダッシュボードに、N Graphは関係マップ・ヒートマップ・分布・外れ値・レーダー・PNG共有に。
GitHubスタイル。日付列を自動検出。タスクカウントや日別合計。年間グリッド&月間カレンダー。
インタラクティブな力学グラフ。ノードドラッグ、物理調整でデータの関係を発見。
散布図: トレンドライン、p値、R²、95% CI。箱ひげ図: 外れ値検出。ヒストグラム: 密度曲線。
英語・日本語・韓国語に完全対応。全UIがローカライズ済み。
シンプルな棒グラフから高度な統計プロットまで
3ステップ。30秒以内。
Chrome ウェブストアから N Graph を追加。アカウント不要。棒・折れ線・円・散布図グラフはずっと無料。
データベースをテーブル表示にした Notion ページに移動。ボード・ギャラリー・タイムライン・カレンダー表示は非対応。
ページ右側の N Graph タブをクリック。10種類のチャートから選択し、PNGで出力。
日常の基本チャートは無料。共有・分析に効く高度なビューはProで。
ご購入時に使用したメールアドレスで拡張機能にログインすると、Proが有効になります。
解約はいつでも可能:拡張機能の設定 →「サブスク管理」から。ログインできない場合は notiongraph123@gmail.com へメールいただければ解約を代行します。
Notion 기본 차트가 생긴 지금, N Graph는 부족한 시각화에 집중합니다. 관계 맵, 히트맵, 통계 차트, KPI, 레이더, PNG 복사/저장을 브라우저 안에서 처리합니다.
* 데이터베이스 테이블 보기만 지원
app.notion.com / www.notion.so 지원. Notion 기본 차트가 다루기 어려운 분석 뷰를 추가합니다.
차트와 원본 테이블을 하나의 자기 완결형 인터랙티브 HTML 파일로 내보내 Notion HTML 블록에 드래그하면 끝. 툴팁, 범례 토글, 테이블 정렬, 팔레트 전환이 Notion 안에서 그대로 작동합니다(CDN·외부 의존성 없음). 물리 시뮬레이션이 있는 관계 맵을 포함한 8종 차트 지원.
Notion이 www.notion.so에서 app.notion.com으로 이전하고 있습니다. v1.3.0는 두 도메인 모두에서 작동합니다. 이전 후 차트가 표시되지 않는다면 확장 프로그램을 업데이트하기만 하면 됩니다.
트렌드 라인, p-값, R², 95% 신뢰 구간이 포함된 산점도를 Pro 구독 없이 사용할 수 있습니다. 축 제목, X/Y min/max, 로그 스케일, 그리드 라인, 눈금 간격 모두 무료 티어에서 조정 가능.
막대 & 라인: X축 열 선택, A-Z / Z-A / 값 오름차순 내림차순 정렬, 0 제외, Y축 누적 모드, 소수점 자리, 베이스라인, 범위. 파이: 라벨 열, 카운트 / 합계 기준, 정렬. Y축 열의 드래그 앤 드롭 재정렬도 지원.
그레이, 블루, 옐로우, 그린, 퍼플, 틸, 오렌지, 핑크, 레드 — 각 색상별 8단계 모노크로마틱 그라데이션. Notion 기본 룩앤필과 조화. 높이(S/M/L), 그리드 스타일, 데이터 라벨, 캡션도 모든 차트에서 설정 가능.
기본 차트는 대시보드 보고에 좋습니다. N Graph는 탐색, 통계 확인, 관계 발견, 빠른 PNG 공유에 집중합니다.
보이는 테이블만 읽습니다. CSV 업로드나 Notion API 토큰이 필요 없습니다.
관계 맵, 캘린더 히트맵, 상자 그림, 히스토그램, KPI, 레이더로 단순 차트 이상의 인사이트를 얻습니다.
PNG 다운로드와 클립보드 복사로 문서, 보고서, 슬라이드에 바로 붙여넣을 수 있습니다.
데이터 내보내기 불필요. CSV 불필요. Notion 페이지에서 직접 동작.
Notion 기본 차트는 대시보드에, N Graph는 관계 맵·히트맵·분포·이상치·레이더·PNG 공유에.
GitHub 스타일. 날짜 열 자동 감지. 작업 카운트 또는 합계. 연간 그리드 & 월간 캘린더.
인터랙티브 그래프. 노드 드래그, 물리 조정으로 숨겨진 관계 발견.
산점도: 트렌드 라인, p-값, R², 95% CI. 상자 그림: 이상치 감지. 히스토그램: 밀도 곡선.
영어, 일본어, 한국어 완벽 지원. 모든 UI 완전 현지화.
간단한 막대 차트에서 고급 통계 플롯까지
3단계. 30초 이내.
Chrome 웹 스토어에서 N Graph를 추가하세요. 계정 불필요. 막대, 라인, 파이, 산점도 차트는 영구 무료.
데이터베이스를 테이블 보기로 설정한 Notion 페이지로 이동합니다. 보드, 갤러리, 타임라인, 캘린더 보기는 미지원.
페이지 오른쪽의 N Graph 탭을 클릭합니다. 10가지 차트 유형 중 선택하고 PNG로 내보냅니다.
일상 기본 차트는 무료. 공유와 분석에 강한 고급 뷰는 Pro로.
결제 시 사용한 이메일로 확장 프로그램에 로그인하면 Pro가 활성화됩니다.
언제든지 해지 가능: 확장 프로그램 설정 → "구독 관리"에서. 로그인할 수 없는 경우 notiongraph123@gmail.com으로 이메일 주시면 해지해 드립니다.